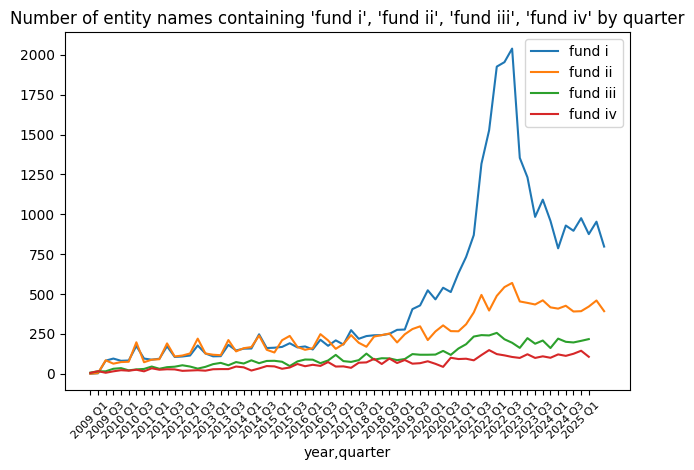
Figure 1**
Above is a graph that displays the amount of Form Ds filed, where the entity (read: company/firm) name contains the phrases "fund I", "fund II", "fund III", and "fund IV". The x-axis is not the prettiest, but it is broken down by quarter. You can see that the line for "fund I" sees by far the greatest peak around quarter 3 of 2022, with a steep drop off immediately after. The other lines have a similar, but less pronounced trend.
So, what is the significance of this? Companies and firms file Form Ds in compliance with Regulation D, which requires disclosure when raising funds under specific circumstances. I won't go into the details here, but the TLDR is that it isn't always required, but it's not uncommon either. Another piece of context is that venture capital firms (among other financial investment groups) label their individual funds, often by appending Fund [<fund roman numeral>] to describe where the fund falls in their sequence of funds. Here is a search query on the SEC filings database. You can see how the naming convention works. Each fund often constitutes its own entity. My hypothesis here is that, by charting the amount of Form Ds filed with "fund [#]" in the name, we can roughly see the state of venture capital “fund” raising.
My Takeaways
1. From this graph we can roughly see the ratio of venture firms that make it to a given fund cycle. That's a little hard to claim as the funds get higher in number, because once firms get large enough, they often stop creating sequential funds, instead raising in parallel and creating funds targeting specific industries/products etc. If you are planning to start a venture firm though, you may gain a bit of insight into your odds of longevity.
2. Venture funding is about to drop off BIG time.
During the early 2020s, everyone and their mom raised a VC fund. This is due to several factors
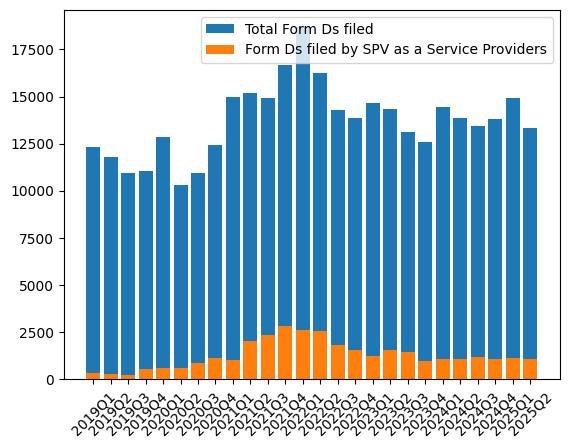
Figure 2
Note that I estimated these values by looking at similarities matching entities listed on the Forms that were also associated with Angellist/Sydecar/other fund backend providers.
These groups likely also contribute to the fluffing of the venture economy by increasing access to investments in startups*.
As interest rates increased, and things settled down, the amount of venture firms raising new funds decrease, as evidenced by the decrease in Form Ds with “fund [#]” in the name after Q3 2022 shown in figure 2.
Why we are going to see the effects of the bubble now
Making the assumptions that a) most venture funds target a life span of ~10 years and b) the capital deployment stage of funds lasts 2-4 years (again, roughly), we are just passing the moment of peak fund availability.
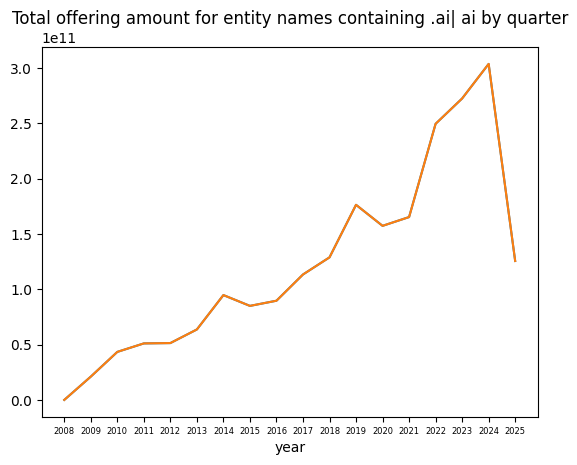
This has all coincided nicely with an immense increase in expectations put on startups focused on AI solutions. Investor interest in wrapper/agent/AI lab companies has seemed insatiable over the past 18 months, in alignment with the end of the funding deployment stage for funds that raised at the peak. This has led to more startups raising rounds at higher valuations (see another keyword search based graph below).
My predictions, based on the above data, and my anecdotal experience is that the amount of venture funding available is about to decrease. This will lead to lower valuations as the supply of funds decreases, inducing relative scarcity. As a result many companies will be left “swimming naked as that tide goes out”. This along with other issues such as (very) newly decreasing expectations of the AI vertical as a whole could lead to a sizable contraction. The decrease in available funding will also put more pressure on companies to actually ** make money **. Unless compute becomes much more cost effective in the immediate future, foundational model providers will be required to raise their prices to supplement equity based funding for compute cost, likely causing wrappers and agent companies to do the same. Some users will be priced out, and likely, many companies will no longer be viable.
All this to say: A future contraction may not be the exclusive result of changing sentiment in the AI industry. Sure that's part of it, but the availability of VC funds has been destined to decrease since firm fundraising peaked in 2022.
Figure 3
The offering amount represents the sum of all “total offering amounts” listed on all Form Ds containing “ ai” or “.ai” in the entity names for a given quarter. Note: 2025 sees a dip because only quarters 1 and 2 are accounted for.
TJ Jefferson
*As a sidenote I do think these services offer ways to anonymize funding sources, and allow potentially less savvy investors (God forbid, unaccredited) to be duped into investing at insanely high valuations.
**This is an updated graph from an the original where some values were double counted. This issue did not change any aspect of the argument laid out in this essay, and the depicted trends are nearly identical. Please email me if you have any questions.
Figure 4